“Consistency is the most powerful force in compounding.”
Among U.S. dividend ETFs, SCHD continues to dominate in popularity.
It offers more than just a high yield — with a high-quality portfolio, systematic rebalancing, and strong long-term performance, SCHD stands out as a balanced and reliable option.
In this post, we’ll cover everything you need to know about SCHD in 2025.
1. ETF Overview
| Item | Details |
|---|---|
| Name | Schwab U.S. Dividend Equity ETF (SCHD) |
| Issuer | Charles Schwab |
| Inception Date | October 20, 2011 |
| Underlying Index | Dow Jones U.S. Dividend 100 Index |
| Expense Ratio | 0.06% |
| Dividend Frequency | Quarterly (March, June, September, December) |
| Dividend Yield | ~4.02% |
| Current Price | ~$26.11 (as of May 2025) |
| Avg Daily Volume | ~16 million shares |
📊 Official Info: Schwab Asset Management – SCHD
What is the Dow Jones U.S. Dividend 100 Index?
The Dow Jones U.S. Dividend 100 Index is a rules-based equity index that tracks the performance of 100 high-quality U.S. companies with a consistent history of dividend payments.
💡 2.Pros & Cons of SCHD
✅ Pros
1. Balanced Between Yield and Growth
SCHD isn’t just another income ETF — it’s a total return powerhouse. With an average annual return exceeding 11% over the past decade, it has proven to be a solid core holding for long-term investors. Whether you’re seeking regular cash flow or steady capital appreciation, SCHD offers a rare balance of both.
2. Strong Dividend Growth
Beyond the attractive ~4% yield, SCHD also shows impressive dividend growth. Over the last five years, the fund has increased its annual dividend at an average rate of around 12%. This kind of consistent growth can significantly enhance total return through the power of compounding.
3. Excellent Risk-Adjusted Performance
SCHD is known for its relatively low volatility compared to the broader market. Its diversified exposure across sectors and high-quality stock selection help deliver more stable performance, especially during market downturns. That makes it appealing for conservative investors or anyone looking for dependable long-term returns.
4. Automated Rebalancing Based on Quality Metrics
The fund undergoes a full reconstitution annually, applying strict criteria including return on assets (ROA), low debt-to-equity ratios, consistent dividend history, and projected yield. For long-term investors, this means less need to micromanage — the ETF automatically stays aligned with its quality standards.
5. USD-Denominated Asset Exposure
Because SCHD is a U.S. dollar-based ETF, it can also act as a currency hedge or diversification tool for international investors. In countries with volatile or weakening currencies, this USD exposure can provide added financial stability.
⚠️ Cons
1. Low Exposure to Tech Sector
SCHD maintains minimal exposure to high-growth technology stocks, which can become a disadvantage during tech-driven bull markets. For example, in 2023–2024, mega-cap tech names like Nvidia, Microsoft, and Meta dominated gains — and SCHD largely missed out on that upside.
2. No Small-Cap or High-Growth Allocation
The fund is heavily weighted toward large-cap, mature companies. While this adds to stability, it limits the fund’s potential for explosive growth. Investors looking for aggressive upside may find SCHD too conservative for their goals.
3. Excludes REITs and MLPs
Even if certain stocks offer high dividend yields, they won’t be included in SCHD unless they meet the fund’s strict quality criteria. As a result, real estate investment trusts (REITs) and master limited partnerships (MLPs) are excluded — reducing exposure to some popular high-income sectors.
4. 15% U.S. Dividend Withholding Tax (for Non-U.S. Investors)
If you’re an international investor, keep in mind that SCHD dividends are subject to a 15% withholding tax by the U.S. government. In many cases, this amount cannot be reclaimed — effectively reducing your net dividend return.
📊 3. Historical Performance (Annualized)
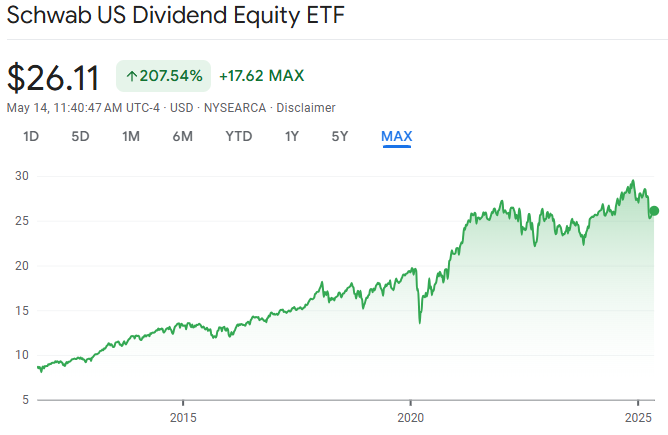
-Historical performance of SCHD – Over 207.54% growth since inception (Source: Google Finance)
| Period | Return |
|---|---|
| 1-Year (2024) | +2.7% |
| 5-Year Avg | +9.6% |
| 10-Year Avg | +11.5% |
📌 Source: Yahoo Finance – SCHD Performance
4. Dividend Growth
📊 SCHD Annual Dividend per Share (2020–2024)
| Year | Annual Dividend |
|---|---|
| 2020 | $2.02 |
| 2021 | $2.25 |
| 2022 | $2.56 |
| 2023 | $2.78 |
| 2024 | $2.94 |
5-Year Average Dividend Growth: ~12%
From 2020’s $2.02 to 2024’s $2.94 — a total increase of ~45%.
SCHD is one of the few ETFs that have consistently raised dividends every year, making it a strong pick for income compounding.
→ What matters more than a high starting yield is a growing income stream over time — and SCHD delivers that.
📌 Source: Digrin – SCHD Dividend Growth
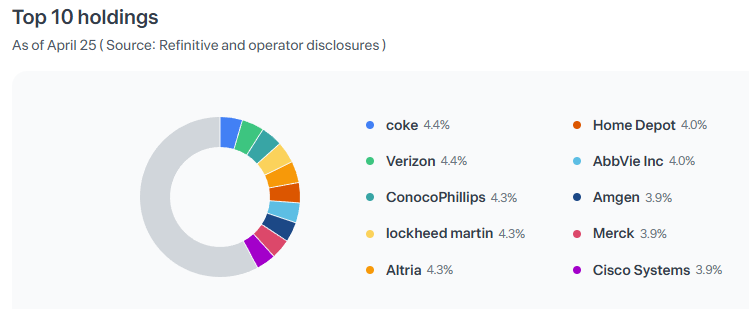
5.📊 Sector Allocation & TOP 10 holdings
| Sector | Weight (%) |
|---|---|
| Energy | 21.08% |
| Consumer Staples | 19.06% |
| Healthcare | 15.68% |
| Industrials | 12.45% |
| Financials | 8.36% |
| Information Technology | 7.87% |
| Consumer Discretionary | 7.86% |
| Communication Services | 4.80% |
| Materials | 2.80% |
| Utilities | 0.04% |
Note: These allocations reflect SCHD’s positioning as of March 31, 2025.
The ETF maintains a strong emphasis on stable, dividend-paying sectors — especially Energy, Consumer Staples, and Healthcare — aiming to reduce volatility and deliver consistent income.
ℹ️ The most recent data available from Schwab Asset Management was published at the end of Q1 2025.
6.Rebalancing Methodology
Rebalance Frequency: Annually in March
Index Used: Dow Jones U.S. Dividend 100 Index
📌 Selection Criteria:
U.S.-based companies only
Minimum 10 years of consecutive dividend payments
Companies are ranked by a composite score based on:
ROA (Return on Assets, cash-flow based)
Debt-to-Equity Ratio
5-Year Dividend Growth Rate
Forward Dividend Yield
Liquidity and market cap screens also applied
⚖️ Weighting Rules:
Maximum 4% per stock
Maximum 25% per sector
❗ Even top-performing stocks may be removed if their metrics no longer meet the criteria.
For example, Broadcom (AVGO) was once a top holding, but was removed in the 2024 rebalance due to:
Rapid stock price increase
Declining dividend yield
Lower composite score
This highlights SCHD’s disciplined, valuation-aware filtering process.
7. Final Thoughts
SCHD is a rare breed — a dividend ETF that combines stability, quality, and long-term performance.
It pays regular quarterly dividends, raises payouts annually, and keeps its holdings in check with strict rebalancing rules.
📌 If you’re a younger investor, SCHD may not be ideal as your primary holding.
Growth-oriented ETFs like QQQ or SOXX may provide greater upside in the early stages of your portfolio.
That said…
✅ SCHD is not a bad ETF by any means — it’s just a different kind of tool.
✅ With its lower volatility and high consistency, it’s perfectly suited for long-term compounding.
✅ And if you can stick with any quality investment for 10+ years,
✅ You’re almost guaranteed to outperform the average retail investor.
⚠️ However, it’s worth noting that SCHD’s current sector composition leans heavily toward energy, consumer staples, and healthcare — sectors known more for stability than aggressive growth.
As a result:
- SCHD may struggle to match its past growth performance, and
- It could underperform compared to tech-focused ETFs in bull markets driven by innovation.
SCHD isn’t flashy, but it’s the kind of ETF that quietly builds real wealth over time — especially for those who value consistency over hype.
🔗 Related Posts
- SPDR S&P 500 ETF Trust(SPY):A Comprehensive
👉 Read Post - Where Innovation Lives – A Deep Dive into QQQ and QQQM
👉 Read Post
💼 Disclaimer
This blog post reflects my personal opinions and investing experience. It is not intended as financial advice. Please always conduct your own research or consult with a licensed advisor before making investment decisions.
📌 Sharing Policy
You’re welcome to share this post or quote parts of it—please credit the original source and include a link back to this blog. Unauthorized copying, pasting, or full reposting without permission is strictly prohibited.