🌟 Why Silver Might Deserve a Closer Look
🤔 “Is silver still relevant in today’s economy?”
With inflation resurfacing, market uncertainty increasing, and industrial demand booming, silver has regained attention among long-term investors and short-term speculators alike.While it’s often compared to gold, silver is more than a “safe haven.” It’s a dynamic asset with dual demand drivers — both monetary and industrial.
So, does SLV, one of the world’s largest silver ETFs, make sense in a diversified portfolio in 2025?
Let’s explore in detail.
📘 What is SLV? Key Facts and Structure
| Item | Details |
|---|---|
| ETF Name | iShares Silver Trust (SLV) |
| Issuer | BlackRock (iShares) |
| Launch Date | April 21, 2006 |
| Index Tracked | Spot Price of Physical Silver (London Fix) |
| Expense Ratio | 0.50% |
| Dividend Yield | None |
| Storage Vaults | London & New York (insured, audited) |
💡 SLV provides direct exposure to silver prices by holding fully allocated physical silver bars.
Custodians conduct monthly audits, purity verification, and publish detailed holdings.
This structure eliminates the complexity of futures contracts or silver mining stock volatility.
📊 Source 👉 iShares SLV ETF Overview
✅ Pros of SLV
- True Silver Exposure – No mining stock risk or futures slippage.
- High Liquidity – $30+ billion in AUM and 20M+ daily share volume.
- Inflation Protection – Silver retains value during monetary instability.
- Industrial Upside – Over 50% of silver is used in clean energy, EVs, and electronics.
- Trustworthy Custody – BlackRock ensures physical backing with full audit transparency.
⚠️ Cons of SLV
- No Income – Not ideal for dividend-focused investors.
- Price Volatility – Reacts quickly to macro fears and industrial shifts.
- Relatively High Fee – 0.50% may be costly for long-term holders.
- Concentration Risk – Pure silver exposure without sector or asset diversification.
🏭 The Industrial Backbone of Silver
Silver plays a critical role in the global green transition:
- Solar Panels – Silver is a top conductor in photovoltaic cells.
- EVs – Used in batteries, sensors, and power systems.
- 5G and Semiconductors – Enables fast, clean electrical transmission.
This industrial demand anchors silver in real economic activity, which distinguishes it from gold.
As the world electrifies and decarbonizes, demand for silver is projected to grow steadily through 2030 and beyond.adily through 2030 and beyond.
📈 Performance: Historical and Recent
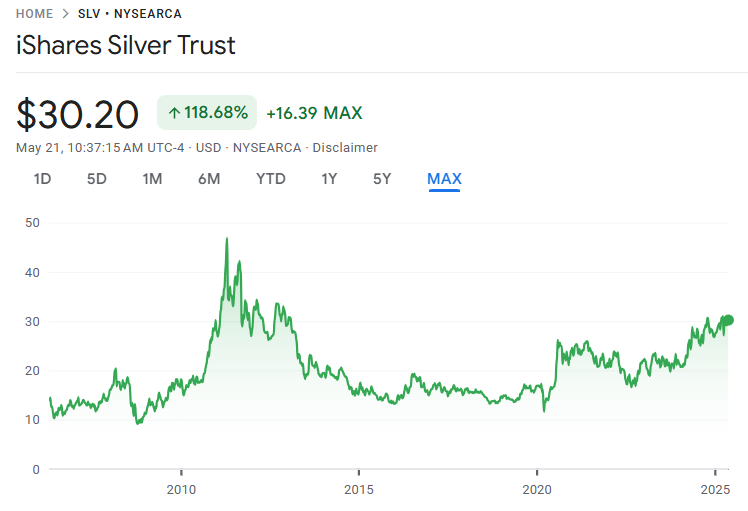
📊 Source 👉 Google Finance – SLV
| Period | Price Change |
| 2020–2025 | ~$16 → ~$30 (+87%) |
| Since Launch | ~$13 → ~$30 (+118%) |
| 5-Year CAGR | ~13.4% annually |
| Since 2006 | ~4.2% CAGR |
SLV performs best during periods of monetary panic and stimulus.
But it’s also prone to sharp corrections — especially when the dollar strengthens or interest rates rise.
📊 Source 👉 Google Finance – SLV
🔄 How SLV Operates: Not Just Buy-and-Hold
Unlike equity ETFs, SLV holds one asset — silver.
No rebalancing occurs.
Operational silver sales cover fees like storage and custody.
This creates a slow but continuous decline in total silver ounces held over time.rise.decrease due to operating expenses — even if silver prices rise.
🔔 Important: Over time, the total silver holdings in SLV slowly decrease due to operating expenses — even if silver prices rise.
💸 Dividend Growth?
SLV doesn’t distribute income or dividends — and this isn’t a temporary policy, but a structural limitation.
Silver doesn’t produce cash flow, so returns come solely from price appreciation.
If you’re building passive income, SLV may not align with your strategy.
However, pairing SLV with dividend-generating assets (like SCHD or REITs) can create a well-rounded portfolio — blending upside with steady yield.
💡 Tip: Some investors use SLV as a “store of value” hedge within a barbell strategy — where silver plays the role of an aggressive, uncorrelated outlier.
📊 Sector Allocation & Holdings
| Category | Detail |
| Asset Type | 100% Physical Silver |
| No. of Holdings | 1 (Silver Bullion Only) |
| Storage Vaults | London & New York (secured, insured, audited) |
| Custody Oversight | JPMorgan Chase (as appointed custodian) |
SSLV stands out in three ways:
- Full Physical Allocation – Each share represents a claim on real silver.
- Monthly Audits & Bar Lists – Vaults are verified and published regularly.
- No Issuer Risk – No exposure to company debt or equity default.
👉 However, be aware of operational shrinkage — silver is gradually sold to cover costs.
And it has zero sector diversification — it’s a pure silver play.
📌 Who Should Consider SLV?
✅ Good Fit For:
- Risk-tolerant investors looking for non-equity inflation hedges
- Those expecting industrial commodity bull runs
- Tactical traders responding to geopolitical shocks
⚠️ Caution For:
Ultra-conservative portfolios
Passive income seekers (no dividends)
🧠 My Take – A Tactical Hedge with a Unique Role
Silver isn’t perfect — but few assets are.
What makes it stand out is its dual personality: it reacts to both panic and progress.
That makes SLV an interesting tool. It’s clean, liquid, and gives access to silver without the mess of mining stocks or futures contracts.
That said, I personally don’t plan to invest in SLV right now.
Not because it’s a bad ETF — but because my capital is limited and I prefer equities and gold, which offer better long-term risk-adjusted potential.
If a macro shock hits — inflation, war, etc. — I might re-evaluate.
But for now, I see SLV as a tactical hedge, not a core portfolio asset.
📌 Please note: This is my highly personal view — not a blanket recommendation. Do your own due diligence and align investments with your own goals.
📎 Related Posts
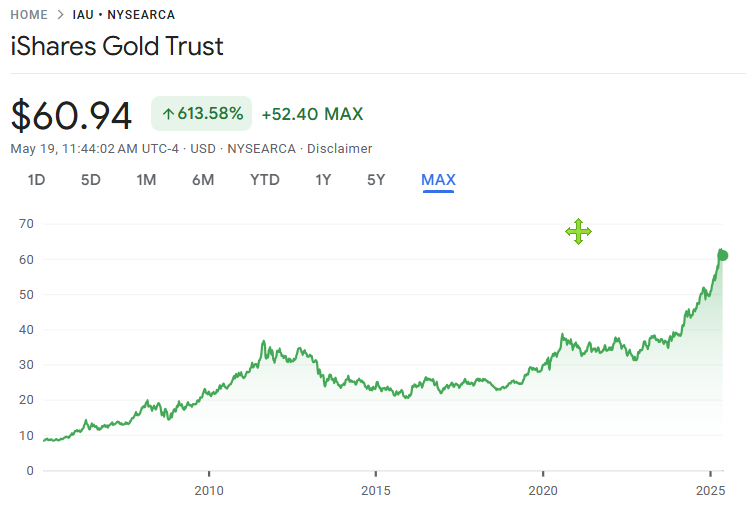
— IAU ETF Review: A Gold ETF Built for Everyday Investors ]
👉 Read Post
– GLD ETF: The Easiest Way to Invest in Gold ]
👉 Read Post
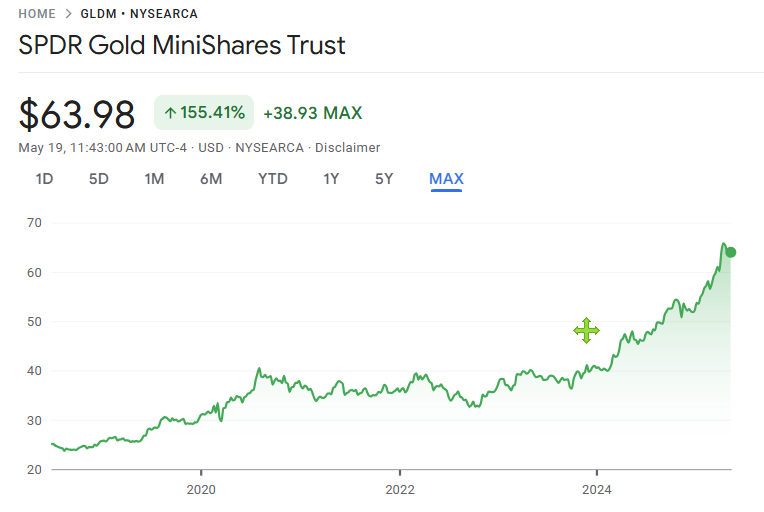
– GLDM ETF Review: The Most Affordable Gold ETF for Long-Term Investors
👉 Read Post
– GLD vs IAU vs GLDM – Which Gold ETF Deserves a Spot in Your 2025 Portfolio?
👉 Read Post
💼 Disclaimer
This blog post reflects my personal opinions and investing experience.
It is not intended as financial advice. Please always conduct your own research or consult with a licensed advisor before making investment decisions.
📌 Sharing Policy
You’re welcome to share this post or quote parts of it—please credit the original source and include a link back to this blog.
Unauthorized copying, pasting, or full reposting without permission is strictly prohibited.