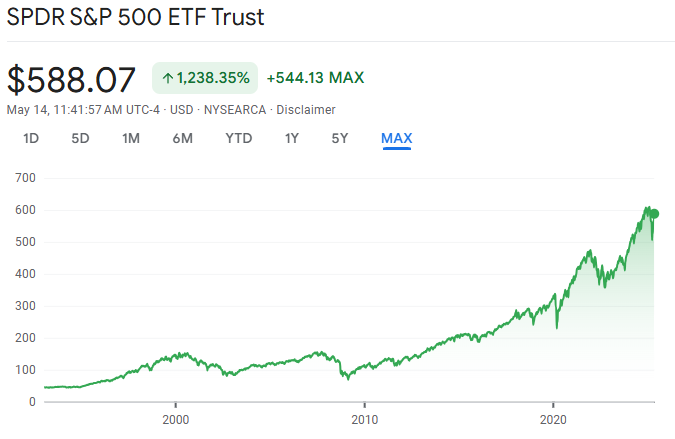
-Historical performance of SPY – Over 1,238.35% growth since inception (Source: Google Finance)
Basic Information
The SPDR S&P 500 ETF Trust, ticker symbol SPY, is one of the most well-known and widely traded ETFs in the world. It was launched on January 22, 1993 by State Street Global Advisors (SSGA) and was the very first ETF listed in the United States.
SPY tracks the S&P 500 Index, composed of 500 large-cap U.S. companies spanning various sectors. It aims to fully replicate the index and operates as a Unit Investment Trust (UIT).
The ETF has an expense ratio of 0.0945% and pays dividends quarterly in March, June, September, and December.
As of 2025, SPY manages over $550 billion in assets and has an average daily trading volume of more than 90 million shares, offering exceptional liquidity and tight bid-ask spreads.
The S&P 500 index is rebalanced quarterly and reconstituted annually, which means SPY’s portfolio is regularly updated to reflect the evolving U.S. market.
Overall, SPY is classified as a large-cap blend ETF, making it a core holding for investors seeking broad U.S. market exposure with a balance of growth and value stocks.
Key Advantages
1)Pioneer in the ETF Market
SPY is the first-ever ETF in the U.S., making it a historic and foundational product in the world of investing.
2)Exceptional Liquidity
SPY is among the most liquid ETFs globally, with massive daily trading volume. This results in tight bid-ask spreads and efficient execution.
3)Accurate Index Tracking
The fund holds all 500 companies in the S&P 500 in proportion to their market capitalization, providing true representation of the index.
4)Transparent and Trustworthy
With daily holdings disclosures and a simple structure, SPY offers clarity and transparency to investors.
5)Automatic Rebalancing
SPY mirrors the S&P 500, which undergoes quarterly rebalancing in March, June, September, and December (usually on the third Friday). This ensures that the ETF always reflects the most relevant large-cap U.S. companies, adjusting its components and their weights without any action required from investors.
Key inclusion criteria:
- Must be a U.S.-based company
- Listed on NYSE, NASDAQ, or Cboe
- Have a market cap of at least $20.5 billion (as of 2025)
- Must have positive net income in the most recent four consecutive quarters
- Sufficient liquidity and public float
- Preferred shares, ADRs, ETFs, closed-end funds, and REITs are excluded
During rebalancing, companies that no longer meet the criteria are removed and new ones are added. For example, in December 2024, Apollo Global Management, Workday, and Lennox International were added to the index, while Catalent, Amentum Holdings, and Qorvo were removed.
Historical Performance
- Over the last 5 years, SPY has delivered an average annual return of around 12%.
- Over 10 years, the return increases to approximately 12.7%.
- Since inception, SPY has shown an average annual return of around 10.3%.
These are total return figures, including price appreciation and dividends, and may vary depending on market conditions.
Dividend Overview
As of May 9, 2025, SPY offers a trailing 12-month dividend yield of 1.27%, with an annual dividend payout of $7.17 per share. Dividends are distributed quarterly, typically in March, June, September, and December.
The dividend growth rate has been consistent over the years:
3-year growth rate: 6.56%
5-year growth rate: 5.27%
10-year growth rate: 6.91%
20-year growth rate: 7.63%
These figures indicate a steady increase in dividend payouts over time, reflecting the underlying growth of the S&P 500 companies.
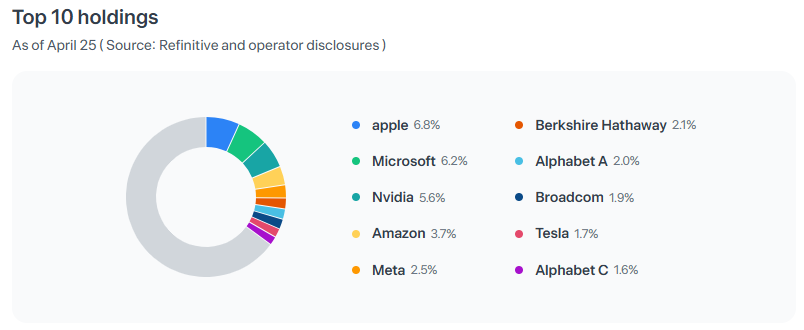
Top 10 Holdings of SPY as of April 2025 (Source: Toss Securities)
Sector Allocation (as of May 8, 2025)
SPY offers exposure to a wide variety of sectors within the U.S. economy:
- Information Technology: 30.91%
- Financials: 14.52%
- Consumer Discretionary: 10.42%
- Health Care: 10.16%
- Communication Services: 9.35%
- Industrials: 8.69%
- Consumer Staples: 6.03%
- Energy: 3.16%
- Utilities: 2.55%
- Real Estate: 2.22%
- Materials: 1.99%
Because of this diversified sector composition, SPY can offer greater portfolio stability even when certain industries face headwinds.
Considerations
- Higher Expense Ratio Compared to Peers
SPY’s expense ratio of 0.0945% is higher than that of some competitors like VOO or IVV, which charge around 0.03%. For long-term investors, this small difference can compound over time. - Top-Heavy Exposure
As a market-cap weighted ETF, SPY allocates a significant portion of its assets to the largest companies like Apple, Microsoft, and Nvidia. This can lead to overexposure to a few mega-cap names, reducing diversification.
Final Thoughts
SPY remains one of the most iconic and dependable ETFs for gaining exposure to the U.S. large-cap market. Its size, liquidity, and long-term performance make it a strong choice for investors seeking a reliable core holding.
That said, while SPY is an excellent tool, I personally don’t invest in it. Instead, I choose other ETFs that track the same S&P 500 Index but come with lower expense ratios. I’ll dive into those choices in a future post.
S&P 500 itself is a cornerstone of my portfolio, and I believe it’s one of the most effective ways to build long-term wealth. If you’re looking for a simple and proven way to invest in America’s top 500 companies, SPY is definitely worth considering.
I’m in this for the long haul—and if you are too, let’s invest together.
Just to be clear — I’m not a financial advisor. I’m simply sharing my personal investing journey here. Please do what feels right for you.
💡 While SPY gives you broad exposure to the entire S&P 500, it may not be aggressive enough for those seeking higher short-term growth. If you’re looking for tech-heavy innovation and volatility, QQQ might be a better fit.
👉 Read Post
💡 On the flip side, if you’re focused on income and dividend stability, SCHD offers a more conservative approach with a strong dividend growth track record.
👉 Read Post
📝 Disclaimer & Final Notes
Just to be clear — I’m not a financial advisor.
I’m simply sharing my personal investing journey here.
Please do what feels right for you. 🙂
Thanks for reading — and as always, invest smart and stay consistent.
See you in the next post! 🚀
Step by step — that’s how we build something lasting.
🔗 Sharing is welcome — but please credit the source (investorJB.com) when you do.