🚀 Introduction: Why Semiconductors Matter
Let’s be honest — can you imagine a world without your smartphone, laptop, or even this very AI assistant?
All of them run on semiconductors.
These tiny chips are the lifeblood of modern tech, powering AI, 5G, EVs, robotics, and more.
And as global demand surges, so does investor interest.
One of the simplest ways to get in? 👉 The iShares Semiconductor ETF (SOXX).
Let’s dive into what makes SOXX a compelling choice — and what you should watch out for.
📌 1. Basic Information
| Item | Details |
|---|---|
| ETF Name | iShares Semiconductor ETF (SOXX) |
| Issuer | BlackRock (iShares) |
| Inception Date | July 10, 2001 |
| Underlying Index | ICE Semiconductor Index |
| Expense Ratio | 0.35% |
| Dividend Frequency | Quarterly (March, June, September, December) |
| Dividend Yield | ~0.95% (as of March 2025) |
| Number of Holdings | 30 |
| Net Assets | ~$10.82 billion |
| Share Price | ~$214.17 (as of May 2025) |
| Average Daily Volume | ~1,000,000 shares |
| Exchange | NASDAQ |
📊 Source 👉 iShares SOXX Fact Sheet
✅ 2. Pros & ⚠️ Cons
✅ Pros
- Pure Semiconductor Focus: Includes top players like Nvidia, AMD, Broadcom, and Qualcomm.
- Exposure to High-Growth Themes: AI, autonomous driving, 5G, and more.
- Easy Access: No need to pick individual stocks — this ETF covers the sector broadly.
- Strong Long-Term Returns: Despite market cycles, the overall trend has been upward.
- Quarterly Rebalancing: Keeps the portfolio aligned with market shifts and prevents over-concentration.
⚠️ Cons
- High Volatility: The semiconductor industry is cyclical and can swing sharply during downturns.
- Relatively High Expense Ratio: 0.35% is on the higher side among tech ETFs.
- Sector Concentration Risk: It focuses only on semiconductors, so diversification is limited.
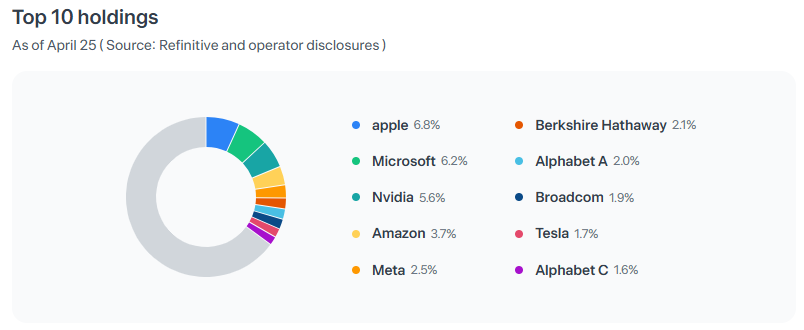
- No Exposure to Tech Giants: Major companies like Apple, Microsoft, and Amazon are not included. You’ll need other ETFs to cover them.
- High Share Price: At over $200 per share, it may be less accessible for those starting with small capital.
📈 3. Historical Performance (CAGR)
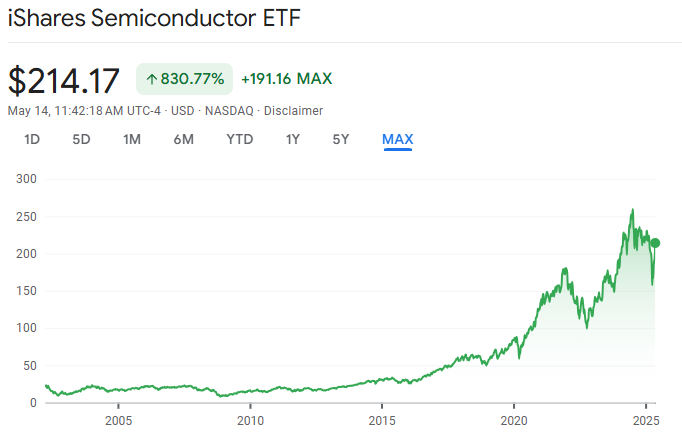
Historical performance of SOXX – Over 830.77% growth since inception (Source: Google Finance)
| Period | Average Return |
|---|---|
| 1-Year | ~48% |
| 5-Year | ~27% |
| 10-Year | ~23% |
➡️ Long-term returns have been strong, especially during major tech cycles led by companies like NVIDIA and Broadcom.
📊 Source 👉 iShares SOXX Performance
💰 4. Dividend Growth
While SOXX is primarily growth-focused, it offers modest dividend income.
| Year | Annual Dividend |
|---|---|
| 2020 | $1.32 |
| 2021 | $1.45 |
| 2022 | $1.58 |
| 2023 | $1.68 |
| 2024 | $1.76 |
This represents a 33% increase over five years, with a compound annual growth rate (CAGR) of approximately 7.4%.
📊 Source 👉 NASDAQ Dividend History – SOXX
5) Sector Allocation & Top Holdings
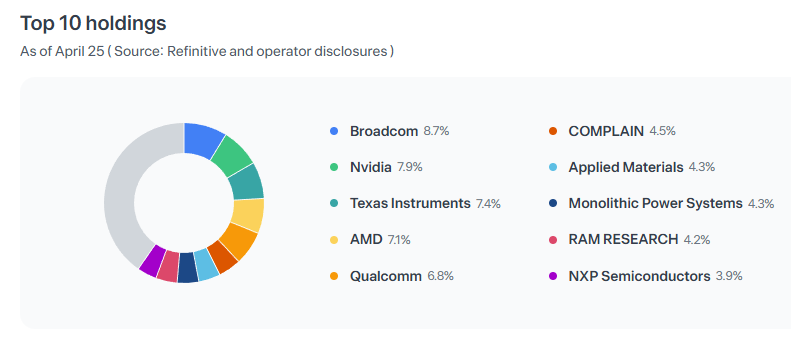
Top 10 Holdings of SOXX as of April 2025 (Source: Toss Securities)
The fund provides balanced exposure to chip design, fabrication, and equipment — covering the full ecosystem.
SOXX holds 30 stocks across the semiconductor space.
Most holdings are large-cap companies, with a few mid-caps included.
📊 Source 👉 Yahoo Finance – SOXX Holdings
🔄 6) Rebalancing Rules & Real-World Examples
- Frequency: Quarterly (4 times a year)
- Method: Adjusts weights based on market cap and liquidity
📌 Example:
- In June 2023, Nvidia’s sharp rise led to a significant increase in its weight.
- In late 2022, Intel’s weaker performance caused its weight to shrink, while growth companies like Marvell gained more presence.
SOXX is structured to adapt quickly to market movements while staying diversified within the sector.
7) Final Thoughts
SOXX’s recent surge in returns was mainly driven by the explosive growth of Nvidia and Broadcom.
However, it’s important to remember that this kind of performance is not guaranteed to continue.
The semiconductor industry follows a well-known cyclical pattern:
- During demand booms, profits and stock prices can soar,
- But in downturns or inventory corrections, the sector often sees sharp declines.
That said, semiconductors remain the backbone of modern innovation — powering AI, cloud computing, smartphones, electric vehicles, robotics, and more.
If you believe in the growth of these technologies, then SOXX could be a strategic way to gain targeted exposure.
📎 Related Posts
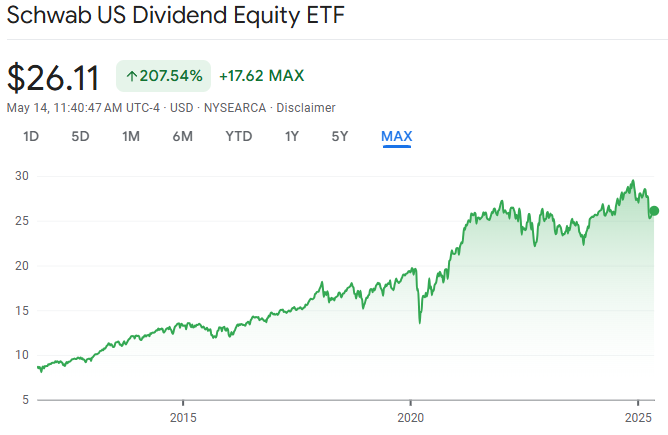
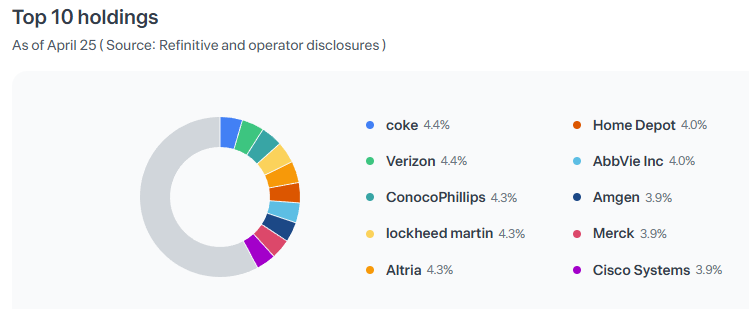
- SCHD ETF Deep Dive (2025): The Smart Pick for Dividends and Long-Term Growth
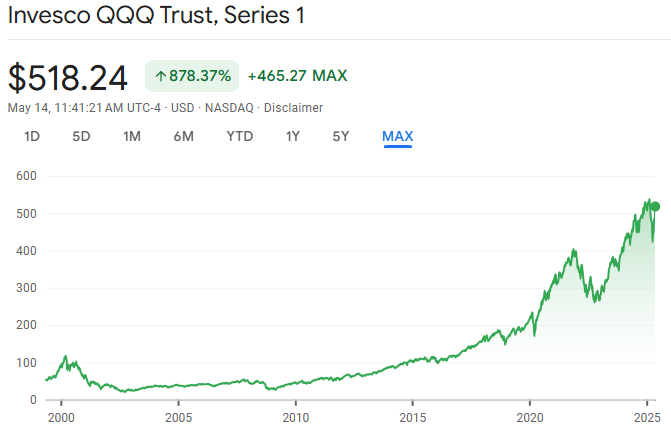
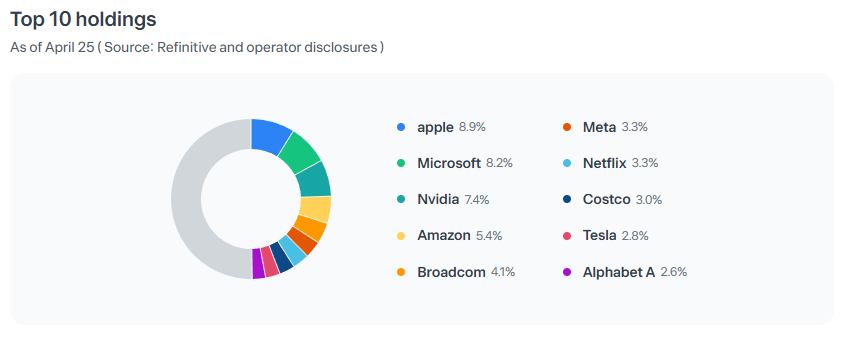
👉 Read Post - Where Innovation Lives – A Deep Dive into QQQ and QQQM
👉 Read Post
💼 Disclaimer
This blog post reflects my personal opinions and investing experience. It is not intended as financial advice. Please always conduct your own research or consult with a licensed advisor before making investment decisions.
📌 Sharing Policy
You’re welcome to share this post or quote parts of it—please credit the original source and include a link back to this blog. Unauthorized copying, pasting, or full reposting without permission is strictly prohibited.