Author: investor JB

  • IVV ETF: The Quiet Yet Powerful Core of S&P 500 Investing

    🙋‍♂️ Which S&P 500 ETF is actually the smartest choice?
    SPY, VOO, IVV… aren’t they all basically the same?

    It’s a fair question — and one every investor has probably asked.
    While these ETFs do track the same index, they’re not identical.

    Their fee structures, fund design, tax efficiency, trading volume, and even public perception vary more than you might think.

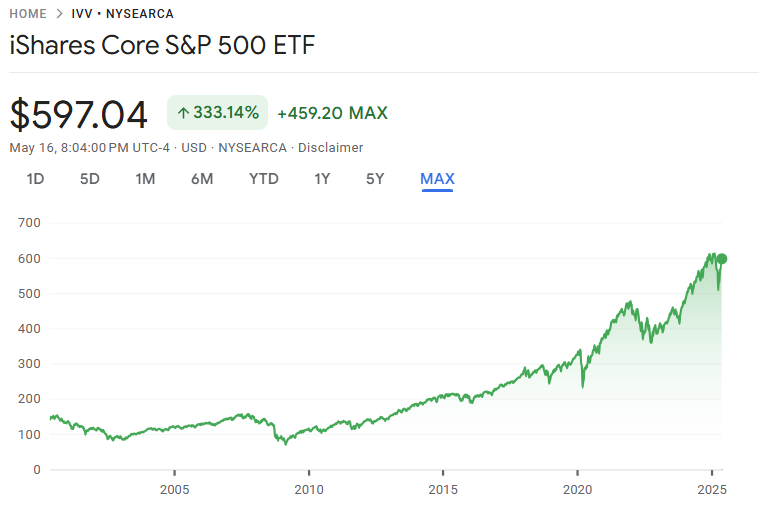
    Today, let’s explore IVV (iShares Core S&P 500 ETF) — a quiet performer that offers stability, efficiency, and trust.
    If you’re a long-term investor looking for a globally respected, low-cost core holding, this ETF deserves your attention.

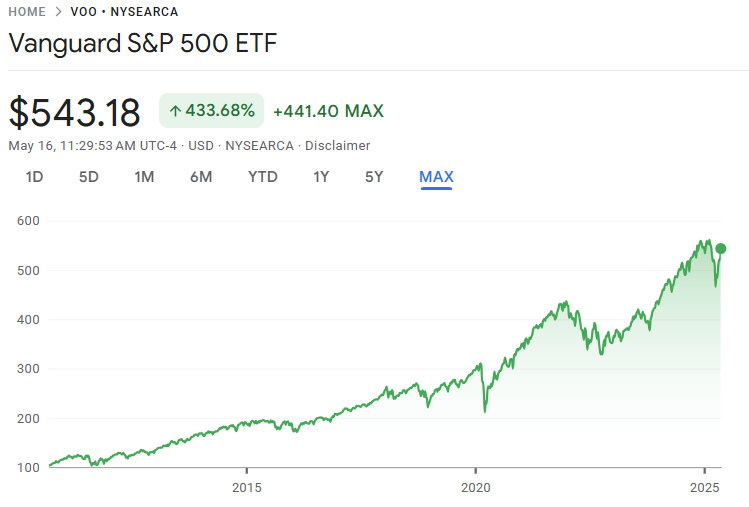
    -Historical performance of IVV – Over 333.14% growth since inception (Source: Google Finance)

    When most people think of S&P 500 ETFs, names like SPY and VOO come to mind.
    But if you’re looking for a fund that combines structural efficiency, institutional trust, and long-term performance,
    IVV – the iShares Core S&P 500 ETF deserves serious consideration.

    Managed by BlackRock, the world’s largest asset manager, IVV is a no-nonsense ETF that delivers exactly what long-term investors need.

    📌 1. Basic Information

    ItemDetails
    ETF NameiShares Core S&P 500 ETF (IVV)
    IssuerBlackRock (iShares)
    Inception DateMay 15, 2000
    Underlying IndexS&P 500 Index
    Expense Ratio0.03%
    Dividend FrequencyQuarterly (Mar, Jun, Sep, Dec)
    Dividend Yield~1.30% (as of May 2025)
    Share Price~$597.04
    Average Daily Volume~4.5 million shares

    📊 iShares Core S&P 500 ETF Fact Sheet
    👉 https://www.ishares.com/us/products/239726/ishares-core-sp-500-etf

    ✅ 2. Pros & Cons

    Let’s break down the key strengths and weaknesses of the IVV ETF in a more practical, real-world context.

    ✅ Pros

    1. Ultra-low expense ratio (0.03%)
    IVV has one of the lowest expense ratios on the market — tied with VOO and significantly lower than SPY’s 0.09%. This makes it an excellent vehicle for long-term compounding.

    2. Tax-efficient structure (for U.S. residents)
    IVV uses an in-kind redemption process, which helps reduce taxable events inside the fund — an advantage particularly relevant to U.S.-based investors.

    3. Institutional-grade reliability
    IVV is widely trusted by pension funds, university endowments, and large institutional investors, largely due to BlackRock’s reputation and operational scale.

    4. Built for modern markets
    The ETF is T+1 settlement compatible and structurally optimized for today’s faster, more automated U.S. trading infrastructure.

    5. Flexible and modern fund structure
    Unlike SPY, which uses an older unit investment trust (UIT) structure, IVV is an open-end fund. This makes it more flexible when it comes to managing dividends, rebalancing, and adapting to regulatory changes.

    ⚠️ Cons

    1. Less brand recognition among retail investors
    While institutions love it, IVV doesn’t have the same name recognition as SPY or VOO in mainstream retail circles.

    2. Slightly lower liquidity than SPY
    Although IVV trades millions of shares daily, it’s still slightly behind SPY in terms of raw liquidity. That could mean marginally wider spreads for short-term traders — though it’s a non-issue for long-term investors.

    3. Nearly identical to SPY and VOO
    Because all three ETFs track the S&P 500 index almost identically, holding more than one might not meaningfully improve portfolio diversification.

    📈 3. Historical Performance (CAGR)

    -Historical performance of IVV
    TimeframeCAGR
    3-Year~10.8%
    5-Year~12.1%
    10-Year~12.5%
    Since Inception+333.14% (as of 2025)

    📊 Google Finance – IVV chart
    👉 https://www.google.com/finance/quote/IVV:NYSEARCA


    💰 4. Dividend Growth

    TimeframeGrowth Rate
    3-Year~6.3%
    5-Year~5.2%
    10-Year~6.8%

    📊 ETF Channel – IVV dividend history
    👉 https://www.etfchannel.com/symbol/ivv/dividends/


    🏗️ 5. Sector Allocation & Top Holdings

    Top 10 Holdings of IVV

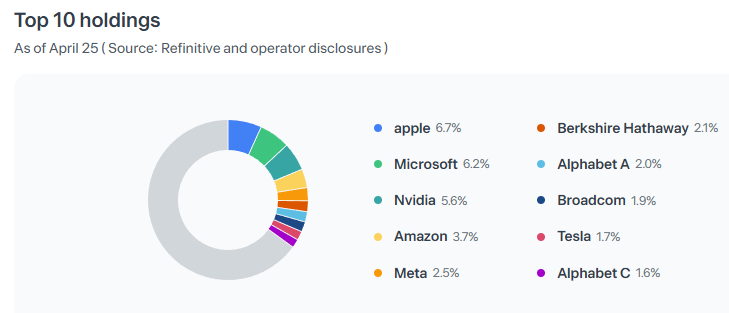
    Top 10 Holdings of IVV as of April 2025 (Source: Toss Securities)

    Total Holdings: ~500

    SectorWeight (%)
    Information Technology30.8%
    Financials14.3%
    Health Care10.3%
    Consumer Discretionary10.0%
    Communication Services9.3%
    Industrials8.5%
    Consumer Staples6.2%
    Energy3.2%
    Utilities2.6%
    Real Estate2.1%
    Materials2.0%

    📊 IVV official holdings (BlackRock)
    👉 https://www.ishares.com/us/products/239726/ishares-core-sp-500-etf


    🔄 6. Rebalancing Frequency & Example

    • Schedule: Quarterly (March, June, September, December)
    • Managed by: S&P Index Committee
    • Implemented by: BlackRock (automatically)

    📌 Real Example from Dec 2024:
    ✅ Added: Apollo Global, Workday, Lennox International
    ❌ Removed: Catalent, Amentum Holdings, Qorvo

    📊 S&P 500 Index Rebalancing Details
    👉 https://www.investopedia.com/index-rebalancing-7972596


    💬 My Take

    IVV doesn’t make headlines — and that’s its strength.

    It’s the kind of ETF you don’t have to think about every day.
    It quietly tracks the market, minimizes drag, and compounds wealth over time.
    And when backed by BlackRock, you get not only low fees, but also institutional trust.

    Personally, I chose SPLG for its even lower price per share and greater flexibility for dollar-cost averaging.
    But if you’re seeking a high-quality, “set-and-forget” core ETF for your portfolio,
    IVV is one of the strongest candidates available — especially for long-term, global investors who prioritize efficiency and stability.

    👉 Explore the SPLG ETF here


    📎 Related Reads


    💼 Disclaimer

    This blog post reflects my personal opinions and investing experience.
    It is not intended as financial advice. Please always do your own research or consult with a licensed advisor before making investment decisions.

    📌 Sharing Policy

    You’re welcome to share this post or quote parts of it — as long as you credit the original source and include a link back to this blog.
    Unauthorized copying, pasting, or reposting in full without permission is strictly prohibited.

  • VOO ETF: The Vanguard Way to Long-Term Wealth

    🤔 Why VOO Is Worth Your Attention

    If you’re building a long-term portfolio, chances are you’ve come across VOO, Vanguard’s flagship S&P 500 ETF.

    It’s not just popular — it’s trusted. Why?

    Because it reflects something deeper than just a list of 500 stocks.
    VOO embodies Vanguard’s core philosophy: ultra-low fees, passive growth, and steady dividend reinvestment.

    Whether you’re tired of active trading or just want a quiet, consistent way to build wealth over time, VOO offers a smart, low-maintenance path.

    Let’s break it down step by step.

    📌 1. Basic Information

    ItemDetails
    ETF NameVanguard S&P 500 ETF (VOO)
    IssuerVanguard
    Inception DateSeptember 7, 2010
    Index TrackedS&P 500 Index
    Index TypeMarket-cap weighted index of 500 U.S. large-cap companies
    Expense Ratio0.03%
    Dividend FrequencyQuarterly (Mar, Jun, Sep, Dec)
    Dividend Yield~1.30% (as of May 2025)
    Current Price~$543.18
    Avg. Volume~5 million shares/day

    📊 Basic Info Source 👉 Vanguard Official Site

    ✅ 2. Pros & ⚠️ Cons

    ✅ Pros

    1. Ultra-low cost
      At just 0.03%, VOO is among the cheapest ETFs on the market — perfect for long-term compounding.
    2. Vanguard’s unique investor-owned model
      Vanguard doesn’t have outside shareholders — it’s owned by its funds, which are owned by investors like you. That means your interests come first.
    3. Ideal for dividend reinvestment
      Consistent quarterly payouts and low fees make this ETF great for automated compounding over decades.
    4. Globally trusted by institutions
      Many pension funds and endowments use VOO as a reliable long-term core holding.

    ⚠️ Cons

    1. Lower liquidity vs. SPY
      While still highly liquid, VOO doesn’t quite match SPY’s volume and tight spreads.
    2. Top-heavy concentration risk
      As a market-cap weighted fund, VOO can become overly exposed to tech giants like Apple, Microsoft, and Nvidia.

    3. 📈 Historical Performance (CAGR)

    -Historical performance of VOO – Over 433.68% growth since inception (Source: Google Finance)

    -Historical performance of VOO – Over 433.68% growth since

    📊 Image Source: Google Finance

    PeriodCAGR
    3-Year~10.8%
    5-Year~12.2%
    10-Year~12.6%

    Thanks to its low expense ratio, VOO often edges out SPY in long-term returns, even though both track the same index.

    📊 Historical Returns 👉 Google Finance – VOO

    4. 💰 Dividend Growth

    PeriodAvg. Growth Rate
    3-Year~6.4%
    5-Year~5.1%
    10-Year~6.9%

    VOO might not offer a high yield, but its steady dividend growth over the years makes it an excellent candidate for reinvestment and long-term compounding.

    📊 Dividend Data 👉 Vanguard – VOO Distribution History

    🧩 5. Sector Allocation & Holdings

    Top 10 Holdings of VOO as of March 2025 (Source: Toss Securities)

    Top 10 Holdings of VOO as of March 2025

    📊 Image Source: Toss Securities

    • Total Holdings: ~500 companies
    • Top Sectors (as of May 2025):
    SectorAllocation
    Information Technology30.7%
    Financials14.4%
    Health Care10.2%
    Consumer Discretionary10.1%
    Communication Services9.4%
    Industrials8.6%
    Consumer Staples6.1%
    Energy3.1%
    Utilities2.6%
    Real Estate2.2%
    Materials2.0%

    📊 Sector Allocation 👉 Vanguard – VOO Portfolio Composition

    🔄 6. Rebalancing Schedule + Real Example

    Frequency: Quarterly — March, June, September, December
    Rebalancing Criteria:

    • U.S.-listed
    • Market cap + liquidity
    • Positive earnings (profitability filter)

    📍 Example: December 2024

    • Added: Apollo Global Management, Workday, Lennox International
    • Removed: Catalent, Amentum Holdings, Qorvo

    These changes are made automatically, with no action needed from investors — truly passive investing at work.

    🧠 Is VOO the Right Fit for You?

    While many ETFs track the S&P 500, not all are created equal.
    What makes VOO stand out isn’t just its ultra-low cost — it’s the Vanguard philosophy that comes with it.

    Unlike SPY (managed by State Street) or IVV (managed by BlackRock), Vanguard is mutually owned by its funds. That means the company has no outside shareholders to satisfy — its only responsibility is to its investors.
    This unique structure aligns the incentives of fund managers and investors, prioritizing long-term performance and cost-efficiency over short-term metrics or flashy growth.

    So, when might VOO be the best fit for your portfolio?
    Here are a few real-world scenarios where this ETF truly shines:

    🔍 Real-World Scenarios Where VOO Excels

    • 📈 Retirement Accounts (IRAs, 401(k)s):
      With its low turnover and rock-bottom expense ratio, VOO is an excellent choice for retirement investors looking to maximize compounding over decades. The less you pay in fees, the more your future self gets to keep.
    • 💸 Dividend Reinvestment Plans (DRIPs):
      VOO pays quarterly dividends and has no hidden costs. That makes it perfect for DRIP investors who want to reinvest payouts automatically — without worrying about fees slowly eating away at their gains.
    • 🏛️ Core Portfolio Holding:
      For those who prefer a “set-it-and-forget-it” strategy, VOO provides broad exposure to the U.S. economy through around 500 of the largest American companies.
      It’s ideal for investors who want to put 70–90% of their portfolio into a single, stable asset — without managing dozens of tickers.

    Whether you’re new to investing or just tired of chasing performance, VOO can serve as the reliable foundation for your financial future.


    🧐 7. Other Considerations

    ✅ Ideal for long-term investors and passive compounding
    ✅ Excellent for dividend reinvestment and consistent growth
    ⚠️ U.S.-only — no international diversification
    ⚠️ Nearly identical to SPY and IVV — no need to hold all three


    ✍️ Final Thoughts (My Take)

    VOO is one of the best ETFs for long-term investors who want to grow their wealth quietly but effectively.

    While SPY is an excellent ETF in its own right — and a pioneer in the ETF industry —
    I personally find VOO more aligned with my long-term investing philosophy.

    Vanguard’s low-cost, investor-first approach gives me more confidence that my money is working efficiently over the decades.
    The slight fee difference between SPY and VOO may not seem like much now,
    but over 10, 20, or 30 years, it can compound into a meaningful edge.

    ✔️ For anyone focused on compounding, dividend reinvestment, and true passive growth,
    VOO is simply built for the long haul.

    📎 Related Posts

    • Choosing the Right S&P 500 ETF: SPY vs. VOO vs. IVV vs. SPLG
      👉 Read Post
    • SCHD ETF Deep Dive: A Dividend-Focused Alternative
      👉 Read Post

    💼 Disclaimer

    This blog post reflects my personal opinions and investing experience. It is not intended as financial advice. Please always conduct your own research or consult with a licensed advisor before making investment decisions.

    📌 Sharing Policy

    You’re welcome to share this post or quote parts of it—please credit the original source and include a link back to this blog. Unauthorized copying, pasting, or full reposting without permission is strictly prohibited.

    Privacy Policy

    👉 Read Post


  • GLD ETF: A Simple Way to Add Gold to Your Portfolio

    Gold has long been seen as a reliable store of value. For those who want to diversify their investments or prepare for uncertain times, SPDR Gold Shares (GLD) offers a straightforward way to gain exposure to the price of gold — without needing to physically store it.

    Let’s explore how GLD works, its key features, and what type of role it might play in an investment portfolio.

    📌 1. Basic Information

    ItemDetails
    ETF NameSPDR Gold Shares (GLD)
    IssuerState Street Global Advisors
    Launch DateNovember 18, 2004
    Index TrackedLBMA PM Gold Price
    Expense Ratio0.40%
    Dividend YieldNone
    Distribution FrequencyNot applicable
    Current Price (May 2025)~$292.85
    Avg. Daily Volume6M+ shares

    🧐 What is the LBMA PM Gold Price?
    The London Bullion Market Association (LBMA) sets the global benchmark price of gold twice daily through an auction-style system among major global banks. It’s considered a trusted and transparent indicator for gold prices worldwide.

    📊 Gold Price Index Methodology
    👉 Source: LBMA

    ✅ 2. Pros & ⚠️ Cons

    ✅ Pros

    1. Direct Exposure to Physical Gold
      GLD gives investors access to gold’s spot price without the inconvenience of storing or insuring physical gold.
    2. High Liquidity
      With millions of shares traded daily, GLD is among the most liquid commodity ETFs, enabling easy entry and exit.
    3. Institutional-Grade Custody and Oversight
      Gold is stored in HSBC’s London vaults and is regularly audited by independent third parties for accountability.
    4. Crisis Hedge and Inflation Protection
      Gold historically performs well in times of economic uncertainty or inflation. GLD allows you to capture that hedge digitally.
    5. Diversification Benefits
      Gold has low correlation with equities and bonds. Including GLD can reduce portfolio volatility during drawdowns.

    ⚠️ Cons

    1.Unfavorable Tax Treatment in the U.S.
    Treated as a collectible under U.S. tax law, with long-term capital gains taxed up to 28%. (Check your local regulations if outside the U.S.)

    2.No Passive Income
    GLD doesn’t pay dividends — not ideal for those who rely on investment income.

    3.Higher Expense Ratio Compared to Peers
    At 0.40%, it’s pricier than competitors like IAU (0.25%) or GLDM (0.10%).

    4.No Physical Redemption for Individuals
    Retail investors can’t redeem shares for physical gold — only large institutions can.


    📈 3. Historical Performance

    Historical performance of GLD
Source: Google Finance

    Historical performance of GLD – Over 553.97% growth since GLD has delivered a total return of over 553.97% since its inception in 2004.

    PeriodReturn
    1-Year (2024–2025)+21.3%
    5-Year CAGR~8.5%
    10-Year CAGR~4.2%

    These figures reflect gold’s resilience during major events like the 2008 crisis, 2020 pandemic, and 2024 inflation shocks.

    📊 GLD Performance History
    👉 Source: Morningstar


    📉 4. Dividend Growth — There Isn’t Any

    GLD doesn’t pay dividends because gold is a non-yielding asset. However, it serves a different purpose in portfolios:

    • Wealth Preservation
    • Defensive Allocation During Bear Markets
    • Psychological Anchor in Times of Uncertainty

    GLD might not generate income, but it can help protect existing capital — especially when markets are turbulent.f your portfolio is under pressure.

    📦 5. Structure and Holdings

    GLD is a grantor trust, holding 100% physical gold bullion — no futures or paper claims.

    • Vault Location: HSBC in London
    • Audited: Third-party verification
    • Scale: Over 900 metric tons of gold (as of May 2025)

    GLD is essentially a single-asset ETF, giving pure gold exposure in a transparent and regulated vehicle.

    📊 GLD Holdings Report
    👉 Source: SPDR GLD ETF Official Website


    🔄 6. Rebalancing Mechanism

    GLD doesn’t rebalance like equity ETFs. Instead, it uses creation and redemption flows:

    • When demand increases, authorized participants deliver gold and receive new shares.
    • When demand drops, shares are redeemed and gold is removed from the vault.

    This system ensures that GLD closely tracks the spot gold price with minimal tracking error.

    📊 GLD Prospectus (Structure & Rebalancing)
    👉 Source: GLD Prospectus – SPDR Gold Trustce.


    🔥 7. What’s Driving Gold Demand? (2024–2025)

    • Central bank buying (de-dollarization)
    • Geopolitical instability
    • Low or negative real rates
    • Weak U.S. dollar
    • Demand from both institutions and retail investors

    🌍 Who’s Buying Gold?

    Buyer TypeMotivation
    Central BanksDiversify reserves
    InstitutionsHedge volatility
    Retail InvestorsInflation protection
    Sovereign Wealth FundsLong-term security
    Asian ConsumersCultural demand

    🤔 Final Thoughts (Including My Perspective)

    GLD isn’t built for growth — it’s built for resilience.

    As a stock-heavy investor, I personally allocate about 5% to gold as a way to hedge against macro uncertainty.
    I see it not as a bet for gold, but as insurance against fiat failure and extreme volatility.

    If you value stability during chaos, GLD may be worth your consideration — even if it’s not flashy.


     📎 Related Posts

    • Is SLV a Smart Investment in 2025? Here’s the Full Breakdown
      👉 Read Post
    • GLD vs IAU vs GLDM – Which Gold ETF Deserves a Spot in Your 2025 Portfolio?
      👉 Read Post

    Privacy Policy

    👉 Read Our Privacy Policy


    💼 Disclaimer
    This blog post reflects my personal opinions and investing experience.
    It is not intended as financial advice. Please always do your own research or consult with a licensed advisor before making investment decisions.


    📌 Sharing Policy
    You’re welcome to share this post or quote parts of it — as long as you credit the original source and include a link back to this blog.
    Unauthorized copying, pasting, or reposting in full without permission is strictly prohibited.

  • SMH vs. SOXX vs. SOXQ: Which Semiconductor ETF Suits You Best?

    Source: Google Finance

    (Source: Google Finance)

    1) Why Compare These Three Semiconductor ETFs?

    Semiconductors are the backbone of modern technology, powering everything from smartphones to electric vehicles. With the rise of AI and data centers, investing in semiconductor ETFs has become increasingly attractive. However, not all semiconductor ETFs are created equal. SMH, SOXX, and SOXQ each offer unique exposures, strategies, and cost structures. Understanding their differences is crucial for aligning your investment choices with your financial goals.

    2) Basic Information Comparison

    AttributeSMHSOXXSOXQ
    IssuerVanEckiShares (BlackRock)Invesco
    Underlying IndexMVIS US Listed Semiconductor 25 IndexICE Semiconductor IndexPHLX Semiconductor Sector Index
    Expense Ratio0.35%0.35%0.19%
    Dividend FrequencyAnnual (December)QuarterlyQuarterly
    Dividend Yield~0.43%~0.8%~1.0%
    Current Price$245.61$212.16$38.61
    Average Volume (3M)~8.57M~4.81M~0.54M

    3) Understanding the Underlying Indices

    • SMH tracks the MVIS US Listed Semiconductor 25 Index, focusing on the 25 most liquid U.S.-listed semiconductor companies, including global giants like TSMC and ASML through ADRs.
    • SOXX follows the ICE Semiconductor Index, comprising 30 U.S.-listed semiconductor firms, offering exposure to major players in the industry.
    • SOXQ mirrors the PHLX Semiconductor Sector Index, encompassing approximately 30 U.S.-listed semiconductor companies, providing a broad representation of the sector.

    4) Holdings Composition

    SMH Top 10 Holdings

    👉 https://www.vaneck.com/us/en/investments/semiconductor-etf-smh/

    CompanyWeight (%)Primary Business
    NVIDIA20.15%GPUs and AI chips
    TSMC11.16%Semiconductor foundry
    Broadcom9.29%Semiconductors
    ASML4.87%Photolithography
    Applied Materials4.69%Semiconductor equipment
    AMD4.51%CPUs and GPUs
    Qualcomm4.45%Mobile semiconductors
    Analog Devices4.43%Analog semiconductors
    KLA4.34%Process control
    Texas Instruments4.33%Analog semiconductors

    SOXX Top 10 Holdings

    👉 https://www.ishares.com/us/products/239705/ishares-phlx-semiconductor-etf

    CompanyWeight (%)Primary Business
    Broadcom9.09%Semiconductors
    NVIDIA8.11%GPUs and AI chips
    Texas Instruments7.49%Analog semiconductors
    AMD7.02%CPUs and GPUs
    Qualcomm6.00%Mobile semiconductors
    Monolithic Power Systems4.58%Power solutions
    KLA4.38%Process control
    Lam Research4.33%Semiconductor equipment
    Applied Materials4.27%Semiconductor equipment
    Microchip Technology4.13%Microcontrollers

    SOXQ Top 10 Holdings 👉 https://www.invesco.com/us/financial-products/etfs/holdings?audienceType=Investor&ticker=SOXQ

    CompanyWeight (%)Primary Business
    NVIDIA11.80%GPUs and AI chips
    Broadcom11.10%Semiconductors
    TSMC8.28%Semiconductor foundry
    AMD4.33%CPUs and GPUs
    KLA4.29%Process control
    Lam Research4.28%Semiconductor equipment
    Applied Materials4.25%Semiconductor equipment
    ASML4.23%Photolithography
    Micron Technology3.94%Memory chips
    Analog Devices3.88%Analog semiconductors

    5) Rebalancing and Management Style

    ETFRebalancing FrequencyManagement Style
    SMHQuarterlyMarket-cap weighted
    SOXXQuarterlyModified market-cap weighted
    SOXQQuarterlyMarket-cap weighted

    6) Pros and Cons Summary

    SMH

    • Pros: High exposure to leading global semiconductor companies; potential for higher returns due to concentrated holdings.
    • Cons: Higher volatility due to concentration in top holdings.

    SOXX

    • Pros: Balanced exposure to U.S. semiconductor companies; well-established ETF with strong liquidity.
    • Cons: Limited exposure to international semiconductor firms.

    SOXQ

    • Pros: Lowest expense ratio among the three; broader diversification.
    • Cons: Lower average trading volume may affect liquidity.

    7) Final Thoughts

    Each ETF has a clearly defined personality:

    • SMH is a growth-focused, high-conviction fund with heavy exposure to global leaders like NVIDIA, TSMC, and ASML.
    • SOXX offers a balanced and reliable way to access top U.S.-listed semiconductor firms.
    • SOXQ stands out with its low expense ratio, decent dividend yield, and much lower share price — making it more accessible for smaller investors.

    Now, let me share my personal view.

    In the past, I would’ve chosen whichever ETF had the lowest expense ratio.
    But this time, my pick is SMH.

    Why?

    Because it aligns with my style — I prefer concentrated exposure to large-cap leaders, and I like that SMH includes key global semiconductor giants, not just U.S. names.
    SOXQ, while cheap and well-diversified, has relatively low trading volume, which makes me hesitant.
    And SOXX, although strong in fundamentals, misses out on non-U.S. exposure, so I naturally ruled it out.

    At the end of the day, your choice should reflect your own strategy.

    Are you looking for maximum growth, maximum balance, or maximum cost-efficiency?

    There’s no right or wrong here — only what’s right for you.


    If you’re also interested in broader tech exposure beyond semiconductors, check out my deep dive on QQQ — the Nasdaq-100 ETF.

    👉 Read Post


    8) Next Topic Preview – GLD ETF: Gold in a Volatile World

    Next up, we’ll shift gears from tech to timeless.
    The GLD ETF is one of the most popular ways to gain exposure to gold, a classic safe-haven asset.
    But how does it actually work? And is it worth holding today?

    Stay tuned as we explore whether gold deserves a spot in your portfolio in 2025 and beyond.


    📝 Disclaimer & Final Notes

    Just to be clear — I’m not a financial advisor.
    I’m simply sharing my personal investing journey here.
    Please do what feels right for you. 🙂

    Thanks for reading — and as always, invest smart and stay consistent.
    See you in the next post! 🚀
    Step by step — that’s how we build something lasting.


    🔗 Sharing is welcome — but please credit the source (investorJB.com) when you do.

  • SMH ETF: A Strategic Bet on the Global Semiconductor Powerhouses


    Historical performance of smh (Source: Google Finance)

    Historical performance of smh – Over 494.59% growth since inception (Source: Google Finance)

    🤔 Why Consider SMH?

    If you want to invest in the future of technology — AI, data centers, smartphones, EVs, and more — then semiconductors are where it all begins.
    Instead of guessing which chip stock will win next, VanEck’s SMH ETF gives you targeted exposure to the world’s biggest and most innovative semiconductor companies.

    Let’s break it down step by step.

    📌 1. Basic Information

    ItemDetails
    ETF NameVanEck Semiconductor ETF (SMH)
    IssuerVanEck
    Launch DateDecember 20, 2011
    Index TrackedMVIS US Listed Semiconductor 25 Index
    Expense Ratio0.35%
    Dividend FrequencyAnnually (typically December)
    Dividend Yield~0.43% (as of 2024)
    Share Price~$247.29 (as of May 2025)
    Avg. Daily Volume~7 million shares/day

    📊 Official Source 👉 VanEck – SMH ETF


    ✅ 2. Pros & Cons

    ✅ Pros

    • Concentrated exposure to top semiconductor names
      Includes Nvidia, TSMC, ASML, Broadcom, and more — the dominant players driving global chip innovation.
    • Global reach
      Not limited to U.S. firms — adds international leaders like TSMC (Taiwan) and ASML (Netherlands) for broader exposure.
    • High liquidity
      With millions of shares traded daily, SMH is easy to buy and sell — even for larger accounts.
    • Simple, large-cap focused structure
      Its 25-company portfolio is easy to understand and heavily tilted toward the most influential chipmakers.

    ⚠️ Cons

    • Limited diversification
      Only 25 holdings = concentrated risk.
    • Top-heavy structure
      The top 5 companies make up more than 50% of the portfolio — meaning one or two stocks can drive (or drag) overall returns.
    • ADR exposure
      TSMC is held via ADRs (American Depository Receipts), which can involve foreign tax complexities.
    • No big U.S. tech names
      Companies like Apple, Microsoft, and Amazon aren’t included — this fund is pure-play semiconductor only.

    3. Historical Performance (CAGR)

    PeriodReturn (Annualized)
    10-Year~25%
    5-Year~28%
    1-Year~50%

    📊 Source 👉 VanEck – SMH Performance Page


    💰 4. Dividend Growth

    YearDividend ($)
    20200.75
    20210.79
    20221.20
    20231.04
    20241.07

    🔎 Note: While not a dividend-focused ETF, SMH’s annual payout has shown gradual growth over time.

    📊 Source 👉 VanEck Dividend History

    5) Sector Composition – What Each Company Does

    SMH holds 25 companies in the semiconductor industry. Here’s a quick breakdown of their roles:

    1. Nvidia (NVDA) – GPU and AI chip design
    2. Taiwan Semiconductor (TSMC) – Leading pure-play foundry (contract manufacturing)
    3. Broadcom (AVGO) – Connectivity and data center chips
    4. ASML (ASML) – Lithography equipment for chip manufacturing
    5. Applied Materials (AMAT) – Semiconductor production equipment and services
    6. AMD (AMD) – CPUs and GPUs
    7. Qualcomm (QCOM) – Mobile chips and communication technologies
    8. Analog Devices (ADI) – Analog and mixed-signal chips
    9. KLA Corp (KLAC) – Process control and inspection equipment
    10. Texas Instruments (TXN) – Analog chips and embedded processors
    11. Micron (MU) – Memory chips: DRAM and NAND
    12. Lam Research (LRCX) – Wafer fabrication equipment
    13. Intel (INTC) – CPUs and semiconductor manufacturing
    14. Cadence (CDNS) – Electronic Design Automation (EDA) software
    15. Synopsys (SNPS) – EDA tools and semiconductor IP
    16. Marvell (MRVL) – Storage, networking, and connectivity chips
    17. NXP (NXPI) – Automotive and secure connectivity chips
    18. Microchip (MCHP) – Microcontrollers and analog solutions
    19. Monolithic Power Systems (MPWR) – Power management chips
    20. STMicroelectronics (STM) – Sensors and analog components
    21. ON Semiconductor (ON) – Power semiconductors and sensors
    22. Teradyne (TER) – Semiconductor testing equipment
    23. Skyworks (SWKS) – Wireless connectivity chips
    24. Qorvo (QRVO) – RF and 5G wireless components
    25. Universal Display (OLED) – OLED materials and technology

    Source: VanEck, ETF.com


    6. Rebalancing Schedule & Real-World Examples

    • Frequency: Quarterly
    • Method: Market cap + liquidity weighted per MVIS methodology

    📌 Notable Events:

    • Nvidia’s 2023 surge caused its weight to balloon
    • In 2022, ASML and AMD underperformed; Broadcom gained relative weight

    📊 Index Methodology 👉 MVIS Index Rules (PDF)


    7. Other Considerations

    • SMH vs. SOXX:
      SMH includes global exposure (e.g., TSMC, ASML), while SOXX is U.S.-only.
    • TSMC via ADR:
      TSMC is held in the form of an ADR (American Depositary Receipt), which allows U.S. investors to access foreign stocks.
      However, this structure can involve foreign tax withholding on dividends and may come with minor structural differences compared to direct U.S. stocks.
    • High concentration = High volatility:
      SMH is more aggressive than broader tech ETFs like QQQ — it’s built for focused exposure, not balance.

    🧠 My Take

    SMH offers focused access to global semiconductor leaders — especially companies like Nvidia, TSMC, and ASML.
    It’s a great fit for investors who want to ride the semiconductor wave without picking individual stocks.

    That said, SMH’s recent performance was largely driven by Nvidia’s explosive growth. Whether this trend continues is uncertain.

    The semiconductor industry is inherently cyclical:

    • When demand surges, prices and profits skyrocket
    • When oversupply or slowdowns hit, the sector can fall hard

    Still, as the backbone of modern tech — AI, smartphones, data centers, EVs, robotics — semiconductors are here to stay.
    SMH gives you a way to invest in that backbone directly.y.


    See you in the next post! 🚀
    Step by step — that’s how we build something lasting


    📎 Related Reads

    • SOXX ETF: An Easy Way to Invest in the Semiconductor Industry
      👉 Read Post
    • SMH vs. SOXX vs. SOXQ: Which Semiconductor ETF Suits You Best?
      👉 Read Post

    💬 What Do You Think?

    Have you invested in SMH — or do you prefer more diversified funds like QQQ or VTI?
    Or maybe you like to build your own tech portfolio?

    👇 Share your thoughts in the comments! Let’s learn from each other.


    💼 Disclaimer

    This blog post reflects my personal opinions and investing experience.
    It is not intended as financial advice. Please always conduct your own research or consult with a licensed advisor before making investment decisions.

    📌 Sharing Policy

    You’re welcome to share this post or quote parts of it — please credit the original source and include a link back to this blog.
    Unauthorized copying, pasting, or full reposting without permission is strictly prohibited.

    Privacy Policy

    👉 Read Post