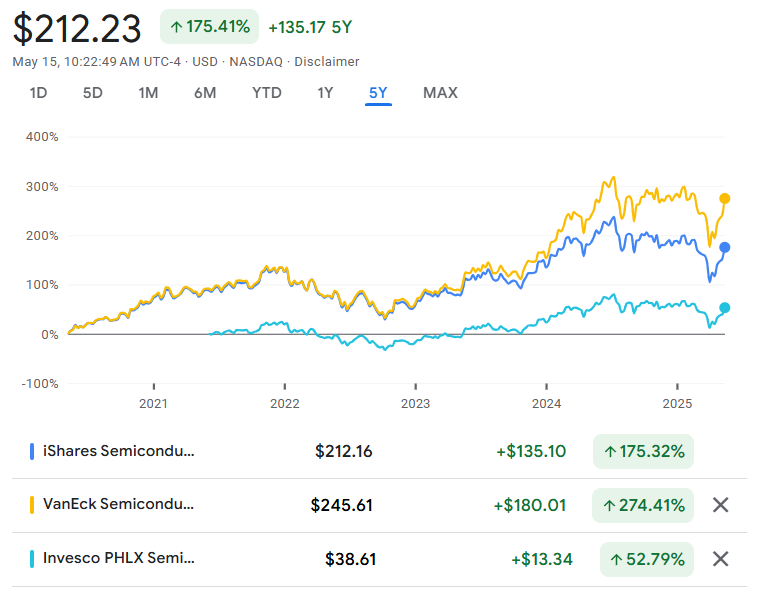
(Source: Google Finance)
1) Why Compare These Three Semiconductor ETFs?
Semiconductors are the backbone of modern technology, powering everything from smartphones to electric vehicles. With the rise of AI and data centers, investing in semiconductor ETFs has become increasingly attractive. However, not all semiconductor ETFs are created equal. SMH, SOXX, and SOXQ each offer unique exposures, strategies, and cost structures. Understanding their differences is crucial for aligning your investment choices with your financial goals.
2) Basic Information Comparison
| Attribute | SMH | SOXX | SOXQ |
|---|---|---|---|
| Issuer | VanEck | iShares (BlackRock) | Invesco |
| Underlying Index | MVIS US Listed Semiconductor 25 Index | ICE Semiconductor Index | PHLX Semiconductor Sector Index |
| Expense Ratio | 0.35% | 0.35% | 0.19% |
| Dividend Frequency | Annual (December) | Quarterly | Quarterly |
| Dividend Yield | ~0.43% | ~0.8% | ~1.0% |
| Current Price | $245.61 | $212.16 | $38.61 |
| Average Volume (3M) | ~8.57M | ~4.81M | ~0.54M |
3) Understanding the Underlying Indices
- SMH tracks the MVIS US Listed Semiconductor 25 Index, focusing on the 25 most liquid U.S.-listed semiconductor companies, including global giants like TSMC and ASML through ADRs.
- SOXX follows the ICE Semiconductor Index, comprising 30 U.S.-listed semiconductor firms, offering exposure to major players in the industry.
- SOXQ mirrors the PHLX Semiconductor Sector Index, encompassing approximately 30 U.S.-listed semiconductor companies, providing a broad representation of the sector.
4) Holdings Composition
SMH Top 10 Holdings
👉 https://www.vaneck.com/us/en/investments/semiconductor-etf-smh/
| Company | Weight (%) | Primary Business |
|---|---|---|
| NVIDIA | 20.15% | GPUs and AI chips |
| TSMC | 11.16% | Semiconductor foundry |
| Broadcom | 9.29% | Semiconductors |
| ASML | 4.87% | Photolithography |
| Applied Materials | 4.69% | Semiconductor equipment |
| AMD | 4.51% | CPUs and GPUs |
| Qualcomm | 4.45% | Mobile semiconductors |
| Analog Devices | 4.43% | Analog semiconductors |
| KLA | 4.34% | Process control |
| Texas Instruments | 4.33% | Analog semiconductors |
SOXX Top 10 Holdings
👉 https://www.ishares.com/us/products/239705/ishares-phlx-semiconductor-etf
| Company | Weight (%) | Primary Business |
|---|---|---|
| Broadcom | 9.09% | Semiconductors |
| NVIDIA | 8.11% | GPUs and AI chips |
| Texas Instruments | 7.49% | Analog semiconductors |
| AMD | 7.02% | CPUs and GPUs |
| Qualcomm | 6.00% | Mobile semiconductors |
| Monolithic Power Systems | 4.58% | Power solutions |
| KLA | 4.38% | Process control |
| Lam Research | 4.33% | Semiconductor equipment |
| Applied Materials | 4.27% | Semiconductor equipment |
| Microchip Technology | 4.13% | Microcontrollers |
SOXQ Top 10 Holdings 👉 https://www.invesco.com/us/financial-products/etfs/holdings?audienceType=Investor&ticker=SOXQ
| Company | Weight (%) | Primary Business |
|---|---|---|
| NVIDIA | 11.80% | GPUs and AI chips |
| Broadcom | 11.10% | Semiconductors |
| TSMC | 8.28% | Semiconductor foundry |
| AMD | 4.33% | CPUs and GPUs |
| KLA | 4.29% | Process control |
| Lam Research | 4.28% | Semiconductor equipment |
| Applied Materials | 4.25% | Semiconductor equipment |
| ASML | 4.23% | Photolithography |
| Micron Technology | 3.94% | Memory chips |
| Analog Devices | 3.88% | Analog semiconductors |
5) Rebalancing and Management Style
| ETF | Rebalancing Frequency | Management Style |
|---|---|---|
| SMH | Quarterly | Market-cap weighted |
| SOXX | Quarterly | Modified market-cap weighted |
| SOXQ | Quarterly | Market-cap weighted |
6) Pros and Cons Summary
SMH
- Pros: High exposure to leading global semiconductor companies; potential for higher returns due to concentrated holdings.
- Cons: Higher volatility due to concentration in top holdings.
SOXX
- Pros: Balanced exposure to U.S. semiconductor companies; well-established ETF with strong liquidity.
- Cons: Limited exposure to international semiconductor firms.
SOXQ
- Pros: Lowest expense ratio among the three; broader diversification.
- Cons: Lower average trading volume may affect liquidity.
7) Final Thoughts
Each ETF has a clearly defined personality:
- SMH is a growth-focused, high-conviction fund with heavy exposure to global leaders like NVIDIA, TSMC, and ASML.
- SOXX offers a balanced and reliable way to access top U.S.-listed semiconductor firms.
- SOXQ stands out with its low expense ratio, decent dividend yield, and much lower share price — making it more accessible for smaller investors.
Now, let me share my personal view.
In the past, I would’ve chosen whichever ETF had the lowest expense ratio.
But this time, my pick is SMH.
Why?
Because it aligns with my style — I prefer concentrated exposure to large-cap leaders, and I like that SMH includes key global semiconductor giants, not just U.S. names.
SOXQ, while cheap and well-diversified, has relatively low trading volume, which makes me hesitant.
And SOXX, although strong in fundamentals, misses out on non-U.S. exposure, so I naturally ruled it out.
At the end of the day, your choice should reflect your own strategy.
Are you looking for maximum growth, maximum balance, or maximum cost-efficiency?
There’s no right or wrong here — only what’s right for you.
If you’re also interested in broader tech exposure beyond semiconductors, check out my deep dive on QQQ — the Nasdaq-100 ETF.
8) Next Topic Preview – GLD ETF: Gold in a Volatile World
Next up, we’ll shift gears from tech to timeless.
The GLD ETF is one of the most popular ways to gain exposure to gold, a classic safe-haven asset.
But how does it actually work? And is it worth holding today?
Stay tuned as we explore whether gold deserves a spot in your portfolio in 2025 and beyond.
📝 Disclaimer & Final Notes
Just to be clear — I’m not a financial advisor.
I’m simply sharing my personal investing journey here.
Please do what feels right for you. 🙂
Thanks for reading — and as always, invest smart and stay consistent.
See you in the next post! 🚀
Step by step — that’s how we build something lasting.
🔗 Sharing is welcome — but please credit the source (investorJB.com) when you do.